PU Prime App
Exclusive deals on mobile


PU Prime App
Exclusive deals on mobile
Nắm giữ thị trường toàn cầu trong tay bạn
Ứng dụng di động giao dịch của chúng tôi tương thích với hầu hết các thiết bị thông minh. Tải xuống Ứng dụng ngay bây giờ và bắt đầu giao dịch với PU Prime trên mọi thiết bị, mọi lúc, mọi nơi.


4 April 2023,06:01
Daily Market Analysis
4 April 2023, 06:01


U.S. equity markets continue to be bullish, with market sentiment continuing upwards after the banking sector woes. Asian markets saw mixed performance due to inflationary worry after a surprise move from OPEC+. The oil cartel further cut production by more than 1 million barrels per day, causing oil prices to buoy above $80. The motive behind this unpredicted move, perhaps, is to drive oil short-sellers out from the trading floor. On the other hand, all eyes are on Australia’s central banks today with its interest rate decision. The Aussie dollar gained around 1.5% last night against the U.S. dollar ahead of the decision announcement, with the markets anticipating a rate hike pause from the RBA as the latest Australian economic data showed that the inflation rate in the country is slowing down.
Current rate hike bets on 3rd May Fed interest rate decision:
Source: CME Fedwatch Tool
0 bps (41.9%) VS 25 bps (58.1%)


The US dollar took a sharp hit amidst lacklustre economic data emanating from the US, tempering market enthusiasm regarding the possibility of an increase in interest rates by the Federal Reserve. The manufacturing sector experienced a considerable decline in March, with a key metric reaching its lowest level since May 2020, as fresh orders and employment indicators dwindled. The Institute for Supply Management’s Purchasing Managers Index (PMI) for US manufacturing fell to 46.3, below market expectations of 47.5 and worse than the previous reading of 47.7.
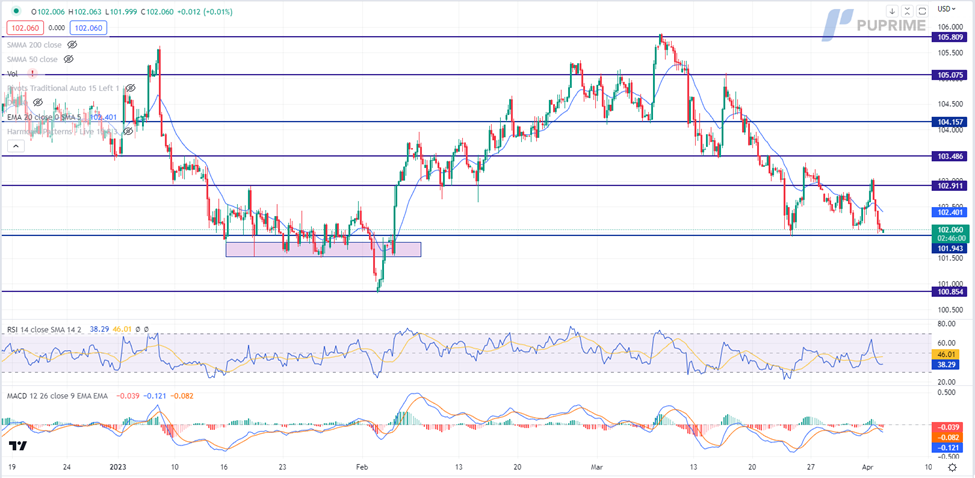
The Dollar Index is trading lower while currently testing the support level. MACD has illustrated increasing bearish momentum, while RSI is at 38, suggesting the index might extend its losses after successfully breakout below the support level since the RSI stays below the midline.
Resistance level: 102.90, 103.50
Support level: 101.95, 100.85
Gold prices experienced a robust surge amid a weakening US Dollar, prompted by declining US Treasury yields as a crucial indicator of US factory activity demonstrated a more significant contraction than expected, thereby reducing the odds for a tighter monetary policy. The Institute for Supply Management’s Purchasing Managers Index (PMI) for US manufacturing fell to 46.3, below market expectations of 47.5 and worse than the previous reading of 47.7.
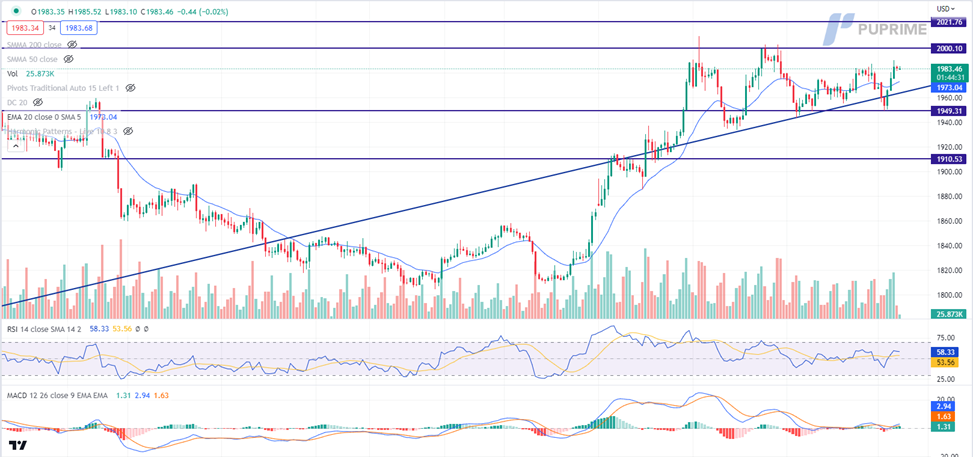
Gold prices are trading higher following the prior rebound from the support level. MACD has illustrated increasing bullish momentum, while RSI is at 58, suggesting the commodity might extend its gains since the RSI stays above the midline.
Resistance level: 2000.00, 2020.00
Support level: 1950.00, 1910.00
The euro turned around and regained what it lost in Monday’s session due to the dollar plummet last night. The dollar surged the day before due to a surge in oil prices, and markets expect the Fed may be more Hawkish in monetary policy to counter the potential increase in inflation with expensive oil prices. However, yesterday the dollar hammered by the weak manufacturing PMI data came at 46.3 which is lower than the market expectation of 47.5. The pair might experience choppy price movement at least before the Non-Farm payroll is released on Friday (7th April).
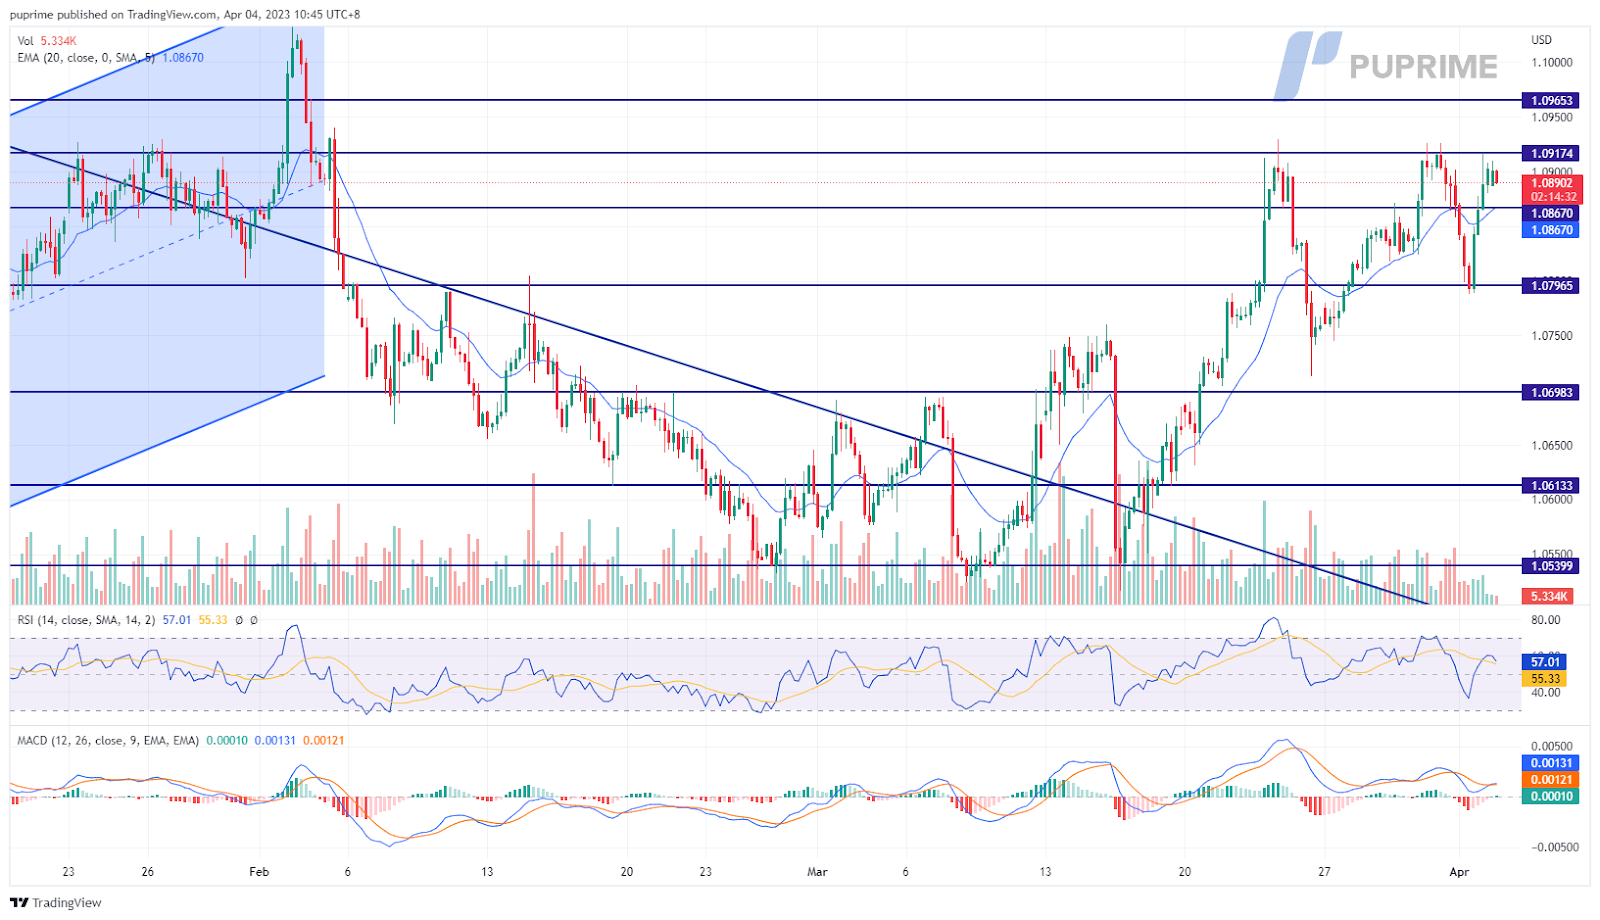
The indicators depict a neutral bullish-bias signal for the pair as the RSI moves toward the overbought zone with a weak momentum while the MACD hovers close to the zero line.
Resistance level: 1.0867, 1.0917
Support level: 1.0698, 1.0613
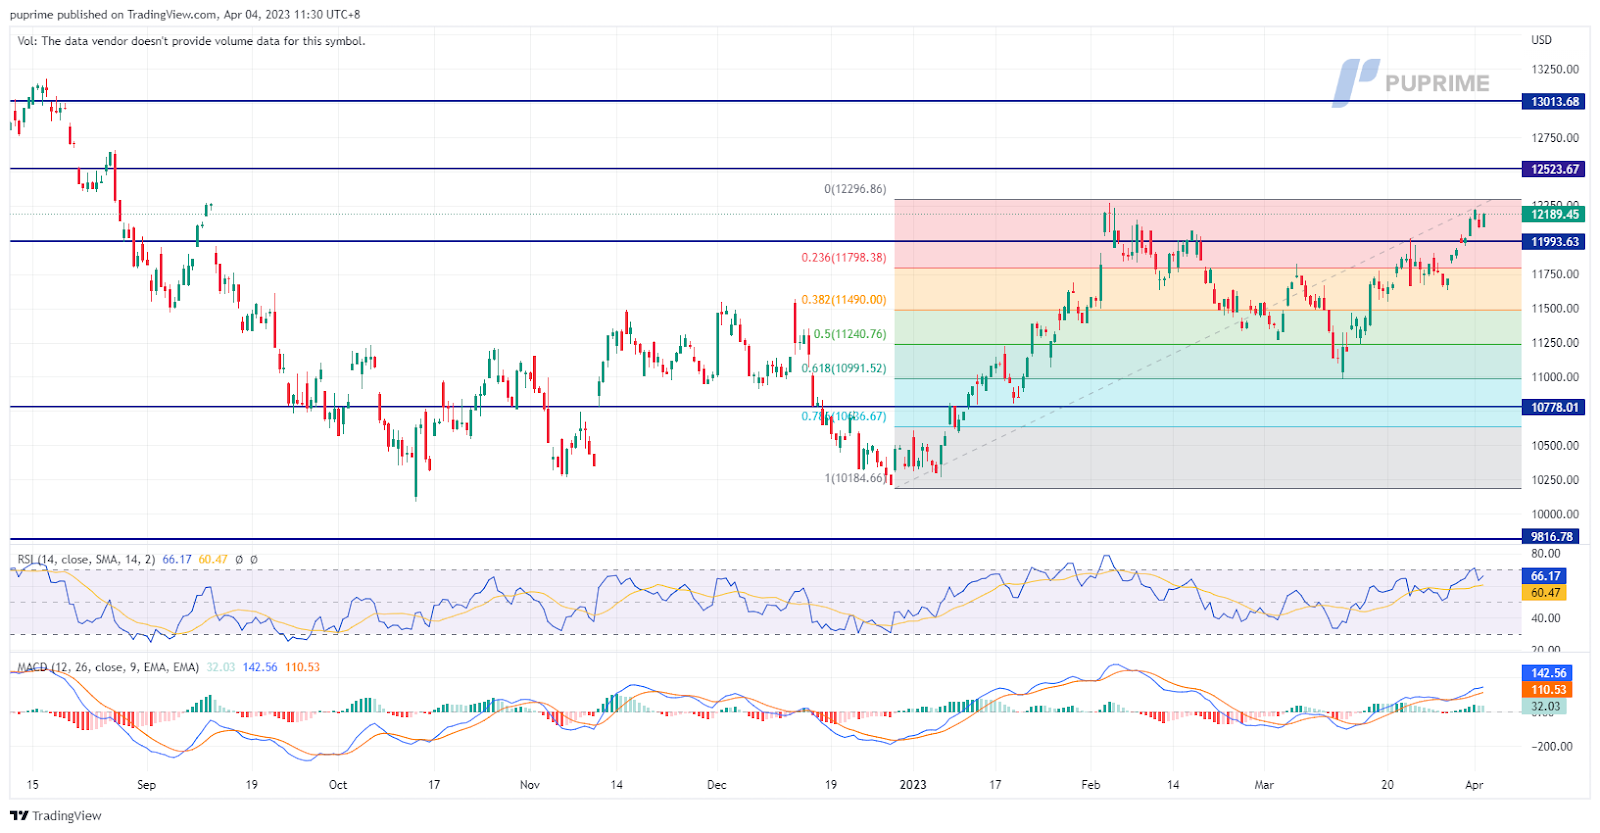
The Nasdaq dropped 0.27% to 12189 points on Monday, mainly weighed down by Tesla Inc (TSLA.O), which fell 6.1% after releasing its March-quarter deliveries increased by just 4% from the previous quarter. However, the prospect of OPEC+’s decision to cut production has driven up the oil prices and added inflation risks as traders raised expectations that the U.S. Federal Reserve might increase another quarter point in May.
As for now, the index is likely to trade on the sidelines as market uncertainty increases. On the technical front, the index manages to stand firm above the support level of 11993 points as of writing. It could form an upward trend ahead of the current support level. Moreover, MACD is illustrating an increasing bullish momentum ahead. RSI is at 66, which also indicates a bullish momentum ahead.
Resistance level: 12523, 13013
Support level: 11993, 10778
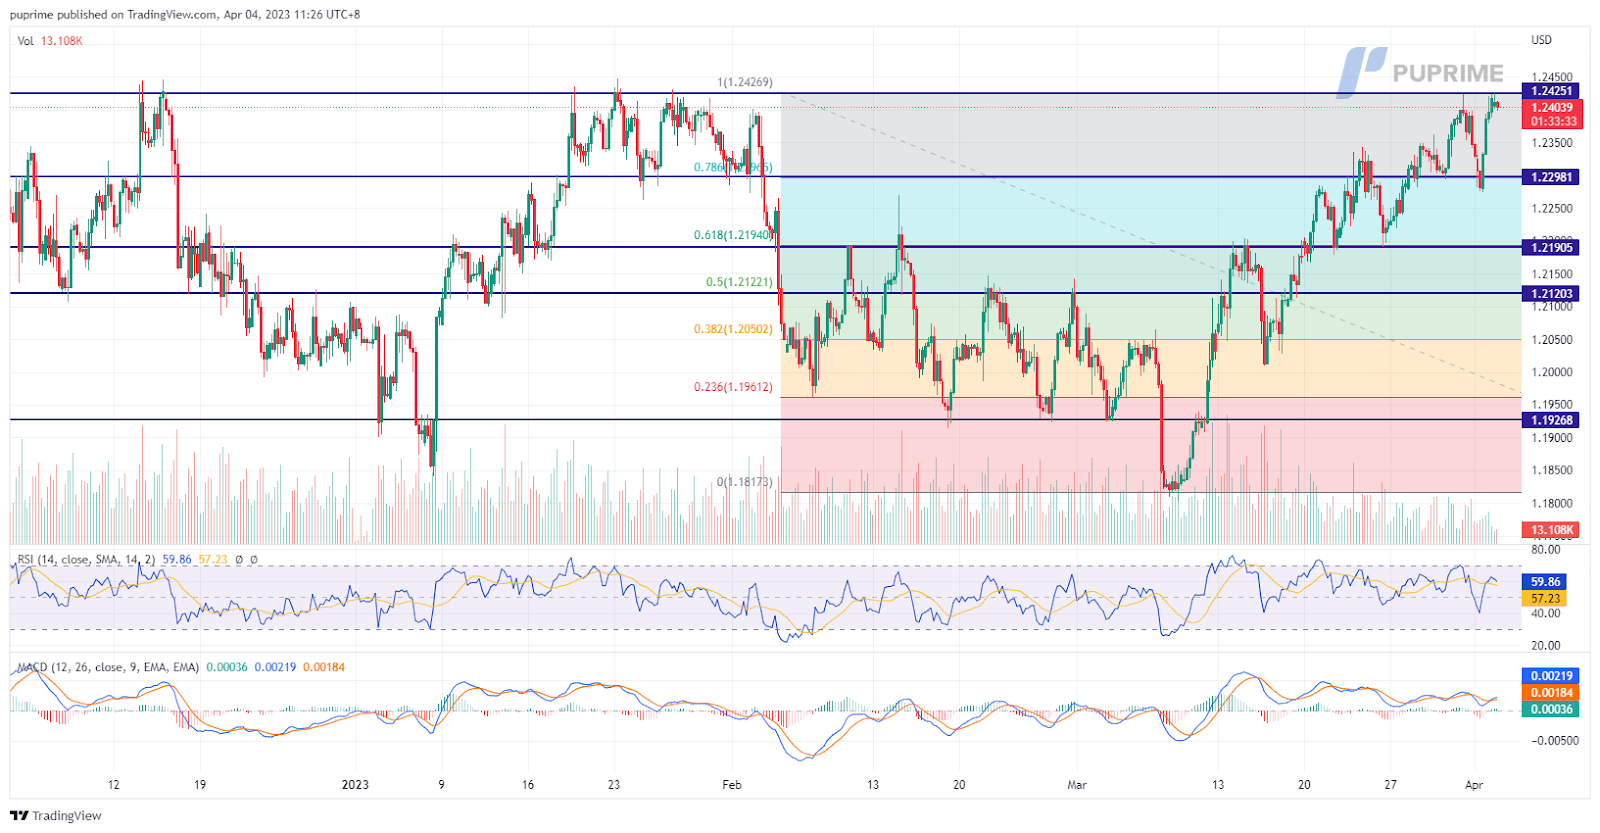
The Pound Sterling rose 1.05% to $1.2405 against the weakened dollar on Monday as the U.S. ISM manufacturing PMI data showed a worse-than-expected reading of 46.3, which failed to meet the market expectation of 47.5. In addition, many economists predict that the Bank of England is still hiking, but it is near the end of its hiking cycle. The overall performance of the pound is the best among currencies, which is surprising because the economic backdrop is not exciting. As for now, attention is staying on the BoE’s rate and the UK’s economic outlook. More data will be released tomorrow, including UK’s composite PMI and Services PMI.
The pound is hovering within the range of 1.2298 to 1.2425 as of writing. The $1.2425 is a crucial resistance level as the price was already tested twice last month. Investors should focus on this psychological level and monitor for the potential break above. If it can spike up, we could expect a bullish trend ahead. MACD illustrates a neutral-bullish momentum. RSI is at 59, which indicates a neutral-bullish momentum ahead.
Resistance level: 1.2425, 1.2613
Support level: 1.2298, 1.2190
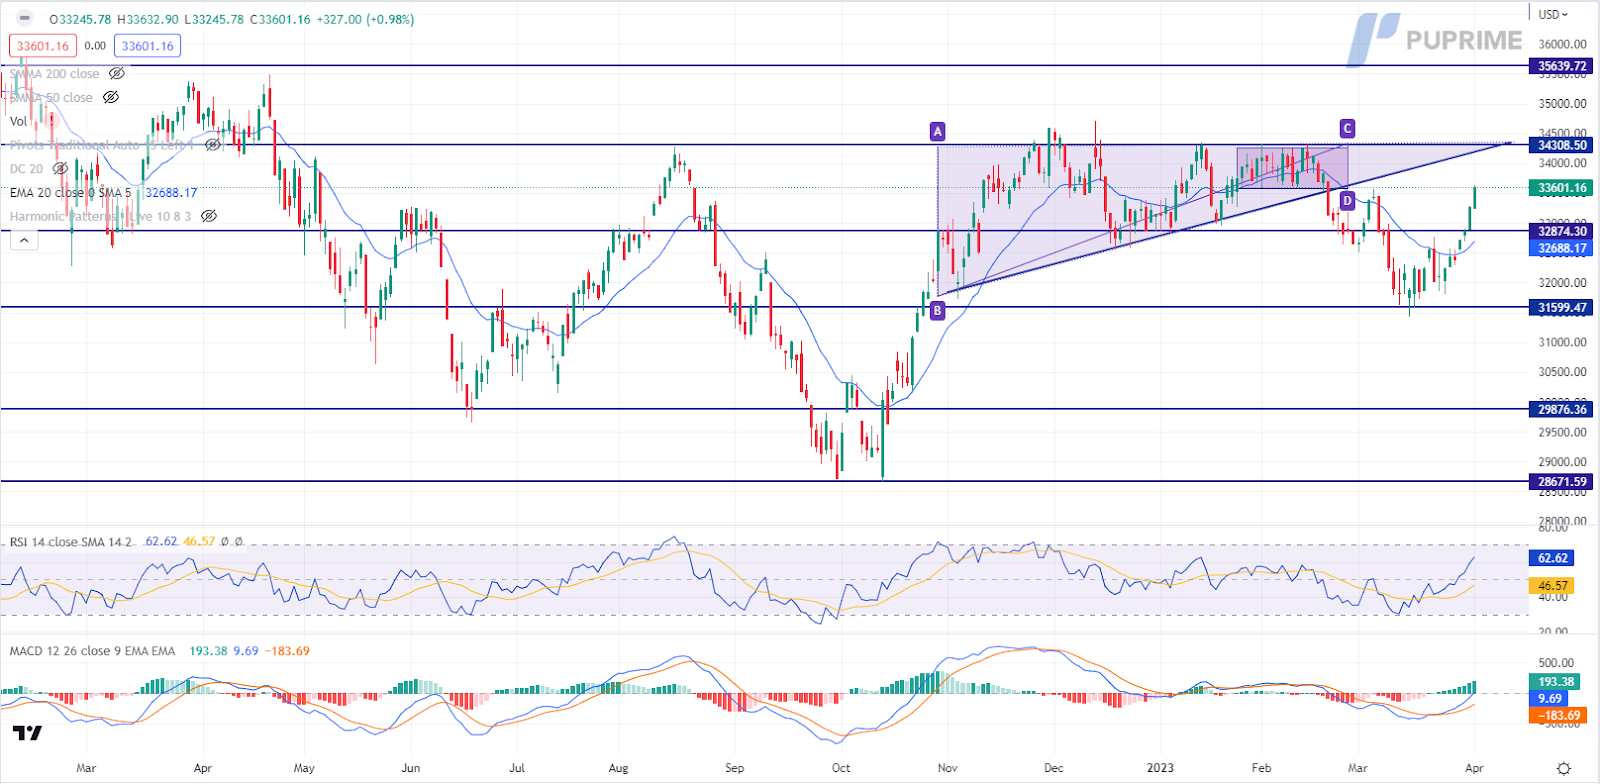
The US stock market recorded gains on Monday, buoyed by an upswing in energy stocks, following surprise cuts to the OPEC+ group’s oil output targets, which set off a bullish surge in oil prices. Chevron Corp, Exxon Mobil Corp and Occidental Petroleum Corp were among the biggest beneficiaries, with all three firms rallying more than 4%. US Treasury yields experienced a decline as a crucial indicator of US factory activity exhibited a more significant contraction than expected, thereby reducing the odds for a tighter monetary policy.
The Dow is trading higher following the prior breakout above the previous resistance level. MACD has illustrated increasing bullish momentum, RSI is at 63, suggesting the index might extend its gains toward resistance level since the RSI stays above the midline.
Resistance level: 34310.00, 35640.00
Support level: 32875.00, 31600.00
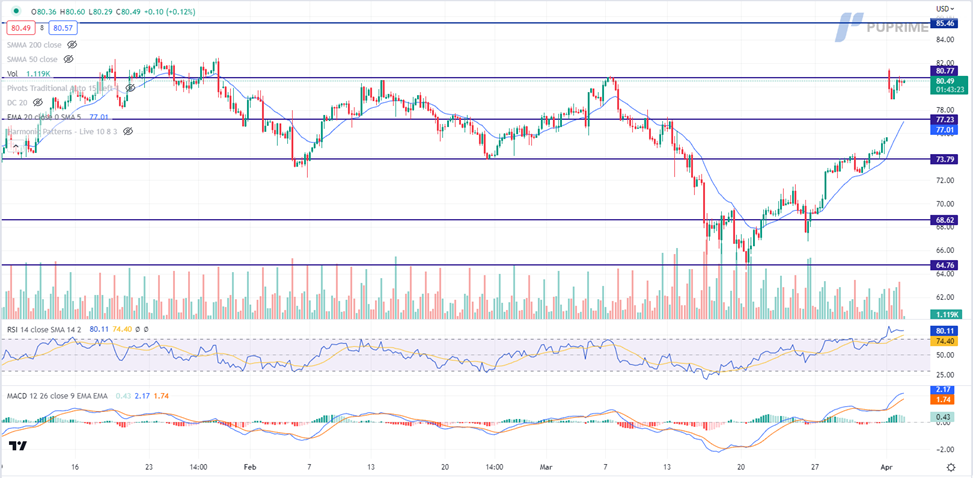
Crude oil prices remained elevated on Monday, extending their gains, and hovering near recent highs as investors continued to digest the implications of the massive production cuts announced by OPEC+ over the weekend. The decision by the Organization of the Petroleum Exporting Countries and its allies, including Russia, to lower their production target by an additional 1.16 million barrels per day (bpd) came as a surprise to the markets and sent shockwaves through the industry. With this latest move, the total volume of cuts by OPEC+ now stands at a staggering 3.66 million bpd, including the 2-million-barrel cuts implemented last October, according to Reuters’ calculations.
Oil prices are trading higher while currently testing the resistance level. However, MACD has illustrated diminishing bullish momentum, while RSI is at 80, suggesting the commodity might enter overbought territory.
Resistance level: 80.75, 85.45
Support level: 77.25, 73.80

Giao dịch ngoại hối, chỉ số, Kim loại,...với phí chênh lệch thấp trong ngành và khớp lệnh nhanh như chớp
Đăng ký Tài khoản Live PU Prime với quy trình đơn giản của chúng tôi
Dễ dàng nạp tiền vào tài khoản của bạn với nhiều kênh nạp tiền và loại tiền tệ được chấp nhận
Truy cập hàng trăm công cụ trong điều kiện giao dịch hàng đầu thị trường
Nền tảng giao dịch
Đào tạo
Công ty
FAQs
Ứng dụng PU Prime - Bắt đầu Giao dịch với một lợi thế


Risk Warning: Trading Contract for Difference (CFD) carries a high level of risk to your capital and may result in losses that exceed your deposits due to leverage. It's important to understand how CFDs work and assess whether you can afford the high risk of losing your money. When acquiring our derivative products, you do not own or have rights in the underlying assets. Past performance is not indicative of future results. The information on this website is general and does not take into account your personal objectives, financial circumstances, or needs. Seek independent advice from qualified experts if necessary, and ensure you fully understand the risks before making any trading decisions.
PU Prime is a brand name of different entities authorised and registered in various jurisdictions.
PU Prime Limited is authorized and regulated by the Financial Services Authority of Seychelles under License No. SD050, with registered address at CT House, Office 1A, Providence, Mahe, Seychelles.
PU Prime Ltd is authorized and regulated by the Financial Services Commission of Mauritius under License No. GB23202672, with registered address at Suite 201 Level 2, The Catalyst Building, 40 Silicon Avenue, Cybercity Ebene, Mauritius.
PU Prime (Pty) Ltd is an authorised Financial Services Provider registered and regulated by the Financial Sector Conduct Authority of South Africa under License No. 52218, with registered address at 37 Harley Street, Ferndale, Randburg, Gauteng, South Africa.
The information on this website is not intended for residents of certain jurisdictions, including the United States, Singapore, Australia, China, Russia, and jurisdictions listed on the FATF and EU/UN sanctions lists. It is not intended for distribution or use where such distribution or use would be contrary to local law or regulation. While the Authority has granted a securities or derivatives investment business licence to the Licensee, it does not endorse the products offered.
Finzero Cap Ltd, registered in the Republic of Cyprus with registration number HE414308 and registered address at 62 Athalassas, Mezzanine, Strovolos 2012, Nicosia, Cyprus.
Copyright © 2024 PU Prime.

Please note the Website is intended for individuals residing in jurisdictions where accessing the Website is permitted by law.
Please note that PU Prime and its affiliated entities are neither established nor operating in your home jurisdiction.
By clicking the "Acknowledge" button, you confirm that you are entering this website solely based on your initiative and not as a result of any specific marketing outreach. You wish to obtain information from this website which is provided on reverse solicitation in accordance with the laws of your home jurisdiction.
Thank You for Your Acknowledgement!
Ten en cuenta que el sitio web está destinado a personas que residen en jurisdicciones donde el acceso al sitio web está permitido por la ley.
Ten en cuenta que PU Prime y sus entidades afiliadas no están establecidas ni operan en tu jurisdicción de origen.
Al hacer clic en el botón "Aceptar", confirmas que estás ingresando a este sitio web por tu propia iniciativa y no como resultado de ningún esfuerzo de marketing específico. Deseas obtener información de este sitio web que se proporciona mediante solicitud inversa de acuerdo con las leyes de tu jurisdicción de origen.
Thank You for Your Acknowledgement!
